Systems thinking with diagrams of effects
Rachel has written a nice blog entry on how to create a diagram of effects. Diagram of Effects (or causal loop diagram) is a systems thinking technique, based on the work by Jerry Weinberg and Peter Senge. I started using them about 8 years ago, to make sense of my experiences with agile software development.
Over the years the technique has proven useful, not only in coaching and workshops, but in all kinds of situations:
- As a sensemaking technique – to make sense of what’s happening in your team or at your client, so that you can take more appropriate, effective action. I started doing systems thinking together with a number of other agile coaches around 2002. It helped us a lot to understand better what agile is all about. We realized among other things that it’s not about my Scrum being better or worse than your XP, but it’s about doing whatever works for your situation.
- To illustrate the dynamics of software development, e.g. technical debt (pdf) or the dynamics of test driven development and pair programming.
- As a means to do root cause analysis in retrospectives – diagrams of effects facilitate team problem solving processes (similar to what David Draper is doing with current reality trees, another systems thinking technique).
- To support sales conversations – we are using diagrams of effects more and more in sales conversations, e.g. clarifying how a website delivers value for a nonprofit organization or explaining the effects of portfolio and risk management.

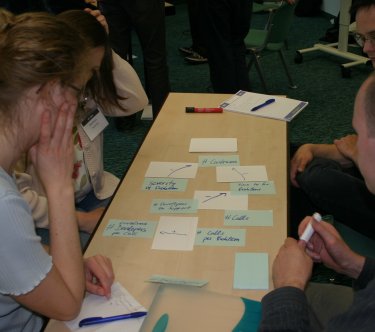
picture by Willem van den Ende
Like Rachel, we create diagrams of effects collaboratively, in small groups, focusing on the conversations and not so much on the diagrams. It is also possible to use the diagrams in a more mechanistic way, creating a precise model of the system and even using it to run simulations. This approach is suitable for knowable problems and situations, not for complex systems like teams and organizations.
Some of the effects we have seen in practice, are:
- Diagrams of effects work as a medium that enables deep conversations – the conversations that change organizations
. The value lies in the process of creating, refactoring, and discussing a diagram collaboratively, less in the resulting diagram (although the diagram can be useful as an illustration, to retell the story).
- They help surface your assumptions. For each causal relation you draw, ask yourself: what assumptions is this relation based on? How can you test these assumptions?
- They shift focus towards the whole system and make clear how everyone/everything plays together, instead of blaming individuals. You’ll see the underlying patterns of behaviour through the incidents. It can help you build your own situated theory of the team/organization dynamics.
So, will diagrams of effects solve all your problems? No, but they are a easy to learn, simple, useful technique that will enrich your repertoire of skills and techniques. As a result you will have more options to choose from and you’re better able to do what fits the situation.
Would you like to know more? Jerry Weinberg’s Quality Software Management: Systems Thinking and Peter Senge’s The Fifth Discipline
are a good start. Alternatively, take a look at systemsthinking.net or contact me.

October 14th, 2009 at 4:31 pm
A few more references:
James D. Hart, Discovering Dynamics in Software Engineering
Tarek Abdel-Hamid and Stuart Madnick, Software Project Dynamics
and one I have not read yet
Raymond Madachy, Software Process Dynamics